


- The average travel time for a container vessel from Asia to the U.S. is between two weeks and a month.
- Documentation, customs clearance, handling and inland shipping can add 17 to 33 days to the total shipping time from most emerging market regions, and another 6 days once goods reach the United States.
- Total shipping costs for importing goods include transit costs from the manufacturer to the foreign port of exit, the port of exit to the U.S. port of entry and the port of entry to the final destination. These costs are in addition to the carrying costs associated with having inventory in transit.
Companies deciding where to locate their manufacturing activities, or whether to source their products in the United States or from overseas, should carefully consider the total costs of shipping. Shipping costs include both the direct and indirect costs of transporting products from their point of origin to their destination market. Expected gains from offshoring can often be erased by long shipping times, rising or fluctuating shipping costs, regulatory fees and unexpected delays.
Shipping costs occur in both directions. They are a cost to U.S. firms that import, and they also are a cost to firms that purchase exported U.S. products. As this website emphasizes, firms worldwide must take into account numerous costs, including and in addition to shipping, when assessing where to produce or make their purchases. The $1.5 trillion in annual U.S. exports over the past six years provides strong evidence that many foreign customers recognize the value of products with the "Made in the U.S.A." label.
Freight Costs and Shipping Time
Most goods imported into the United States travel by land or sea – less than one percent of the total imports by weight arrive by air. This is due in large part to the substantial cost of air freight, which the World Bank estimates is 12 to 16 times more expensive than ocean freight. Whatever the mode of transportation shipping involves multiple costs, including container fees, packaging, terminal handling and broker fees. In order to get a complete picture of shipping costs, each of these factors should be taken into account.
In addition to financial costs, shipping goods internationally takes time. For example, goods shipped from China, on average, take around 14 days to reach the West Coast or 30 days to reach the East Coast.[i] If there are any problems with the final goods delivered to the United States, or if a fast resupply becomes necessary, it can be difficult or impossible to receive a new shipment in time.
In order to save on fuel costs, many ocean shipping lines use slow steaming on many of their routes. Pioneered by Maersk Line, slow steaming involves ships sailing at low speeds to reduce the amount of fuel consumed. This reduces costs for the shipping companies, but it increases the amount of time it takes to move goods from one place to another.
Slow steaming has quickly become the preferred method used by ocean shipping lines for both economic and environmental reasons. A recent study published in the Journal of Maritime Economics and Logistics estimates that “extra slow steaming” is the most beneficial vessel speed, reducing costs for the transport company by 20 percent (which can pass those savings on to the manufacturers whose goods they carry) and reducing carbon dioxide emissions by 43 percent. However, extra slow steaming reduces speed by 25 to 40 percent from normal speeds. Slow steaming adds as many as ten extra days in shipping from China to the United States. While reduced shipping costs might be attractive, they come with a price – even longer shipping times.
Long shipping times also play a role in product returns. Any items that must be returned to the factory or point of origin must again travel the two to four weeks required to get there or be shipped by air, which is considerably more expensive than shipping by sea. If a customer requires a new or replacement item right away, this will almost always require costly air freight.
Infrastructure
Before being loaded on a freighter or airplane, goods must travel from the factory to the port. The overall quality of the foreign transportation infrastructure, which includes roads, railroads, ports and air transportation networks, varies across countries and has a direct bearing on the total time and cost of shipping. To help gauge the relative differences in individual countries' infrastructure it is worthwhile to consult the World Economic Forum's latest Global Competitiveness Report. The report provides data on 138 countries.
The chart below shows the infrastructure scores for the United States and several important countries in the international manufacturing sector. These scores include ratings of countries' transportation infrastructure, in addition to electricity generation and telecommunications. The overall quality of infrastructure in the United States is shown to be more competitive than the infrastructure in emerging markets like Brazil, China and Mexico, and comparable to, albeit often ranked lower than, the infrastructure of other major trading partners.
Global Competitiveness Index Infrastructure Score, 2016-2017
(1 to 7, with 7 being most desirable)

Source: Economics and Statistics Administration analysis using data from the World Economic Forum, Global Competitiveness Report 2016-2017.
It is important to understand that these numbers are averages, and companies usually locate in the parts of countries that have good infrastructure. Furthermore, holding an infrastructure advantage at any given moment does not guarantee a continued advantage in the future. Many countries, in order to increase the competitiveness of their markets, are engaged in infrastructure improvement projects.
Regulatory Costs and Delays
Goods moving across borders also incur fees and require regulatory paperwork, which is easy to overlook when calculating shipping costs. Time matters when getting products to market. According to the World Bank's Doing Business project, the time required to export goods, including documentary and border compliance, can vary dramatically from country to country.[ii] The following table illustrates these differences by showing the time and cost required to export from each major region, with the United States shown for comparison. It is relatively quick, easy, and inexpensive to export from the United States.
| Time to export (hours) |
Cost to export (US$) |
|
|---|---|---|
| United States | 4 | $235 |
| East Asia & Pacific | 130 | $534 |
| Eastern Europe & Central Asia | 55 | $306 |
| Latin America & Caribbean | 119 | $637 |
| Middle East & North Africa | 142 | $721 |
| OECD High-Income Countries | 15 | $186 |
| South Asia | 137 | $559 |
| Sub-Saharan Africa | 196 | $813 |
Source: Economics and Statistics Administration analysis using data from the World Bank, Doing Business project.
Time Required for Documentary and Border Compliance to Export Goods by Country
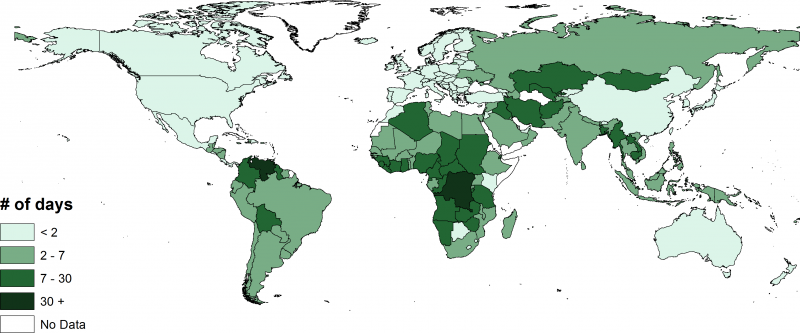
Source: Economics and Statistics Administration analysis using data from the World Bank, Doing Business project.
Cost Associated with Documentary and Border Compliance Required to Export Goods by Country
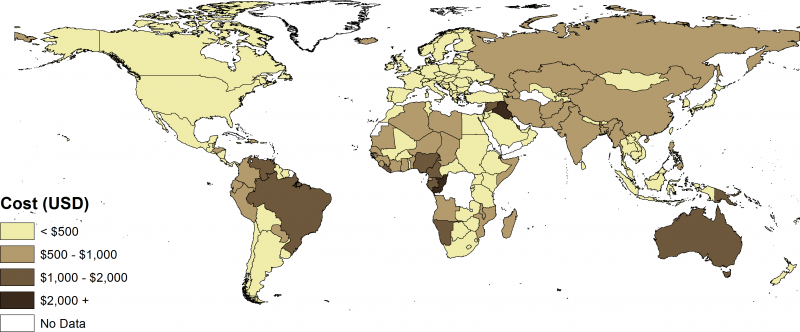
Source: Economics and Statistics Administration analysis using data from the World Bank, Doing Business project.
Duties
Rates of duty on imported goods vary according to the country of origin. These rates can be obtained from the Harmonized Tariff Schedule of the United States. An annotated loose-leaf edition of the schedule may be purchased from the U.S. Government Publishing Office. The schedule is also available on the website of the U.S. International Trade Commission.
Imports from most countries are dutiable at the normal trade relations rates under the General header in Column 1 of the tariff schedule. Goods from countries that do not have normal trade relations with the United States are dutiable at the full rates in Column 2 of the tariff schedule. Goods from some countries enjoy duty-free status. They are shown under the Special header in Column 1 of the tariff schedule.
Currently, several countries, including Cuba and North Korea, do not have normal trade relations with the United States. The U.S. Department of the Treasury maintains a list of all countries under U.S. sanctions. For more information, contact the Office of the U.S. Trade Representative.
Conclusion
Shipping costs include both direct and indirect costs. When assessing the costs of manufacturing or sourcing overseas, firms should take into account freight costs, shipping time, infrastructure, duties, and regulatory costs and delays when assessing where to produce or make their purchases.
[i] Economics and Statistics Administration analysis of search results from Linescape. Linescape is a search engine for container shipping schedules.
[ii] The World Bank's Doing Business project provides objective measures of business regulations for local firms in 189 economies and selected cities, with topics spanning: starting a business; dealing with construction permits; getting electricity; registering property; getting credit; protecting investors; paying taxes; trading across borders; enforcing contracts; and resolving insolvency.