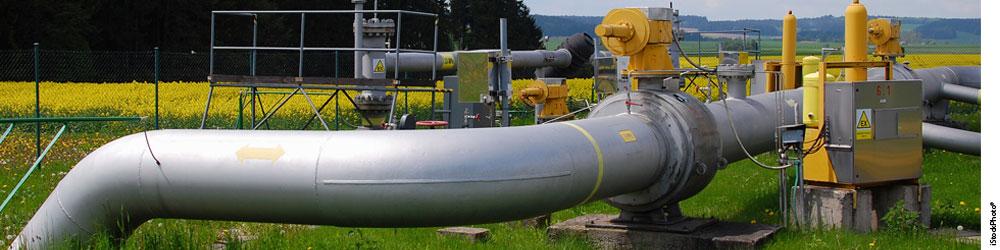


- Natural gas is an important source of both energy and raw materials in manufacturing, and booming domestic production has greatly lowered the price of this important input.
- While it is difficult to compare real estate prices across countries, registering a property can be significantly faster and less expensive in the United States than in other countries.
There are many physical inputs to consider in the manufacturing process, and their relative costs can sway cross-country comparisons considerably. The discussion below focuses on three – energy, raw materials and land – and underscores how quickly costs can change. Over the last few years, the United States has experienced a boom in natural gas production, lowering prices and dramatically increasing the availability of natural gas as both a raw material and a source of energy. Meanwhile, the United States remains among the most attractive locations for energy infrastructure and efficient real estate markets.
Natural Gas
Since 2007, the United States has seen a dramatic, ten-fold increase in the production of natural gas from shale formations – exemplified by the quadrupling of Pennsylvania's production between 2009 and 2011. Reserves of natural gas within U.S. shale formations, less than 10 percent of the total natural gas stock only a few years ago, now account for over half of all natural gas reserves.
U.S. Natural Gas Proved Reserves
2000 – 2015

Source: Economics and Statistics Administration analysis using data from the Department of Energy, Energy Information Administration.
Inexpensive U.S.-produced natural gas has multiple industrial uses ranging from onsite electricity generation to process heating, space heating, steam generation and petrochemical processing. The low cost of natural gas combined with its flexible use are factors in the United States' favor when firms make total cost assessments. There is ample evidence that the country's natural gas boom is sparking an expansion in petrochemical manufacturing as well as in the manufacturing of steel and equipment needed for gas extraction.
Shale Plays in the United States
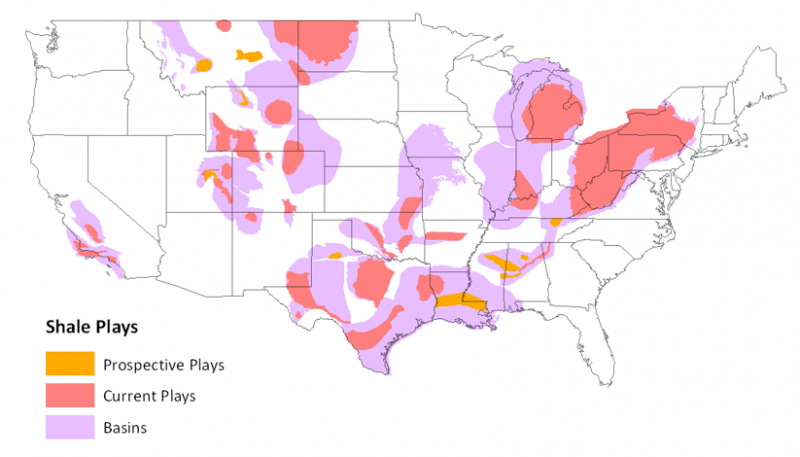
Source: Economics and Statistics Administration analysis using data from the Department of Energy, Energy Information Administration.
This dramatic increase in natural gas reserves and the technology for extracting it has led to a revolution in natural gas prices. For many raw material inputs and energy goods, there is relatively little variation across countries in price – natural gas has become a major exception. The surge in U.S. domestic production has brought U.S. market prices down dramatically. While prices in Europe and Asia have fallen over the past several years, U.S. natural gas prices remain significantly lower than those in other countries.
Natural Gas Prices in U.S. Dollars
2001-2016
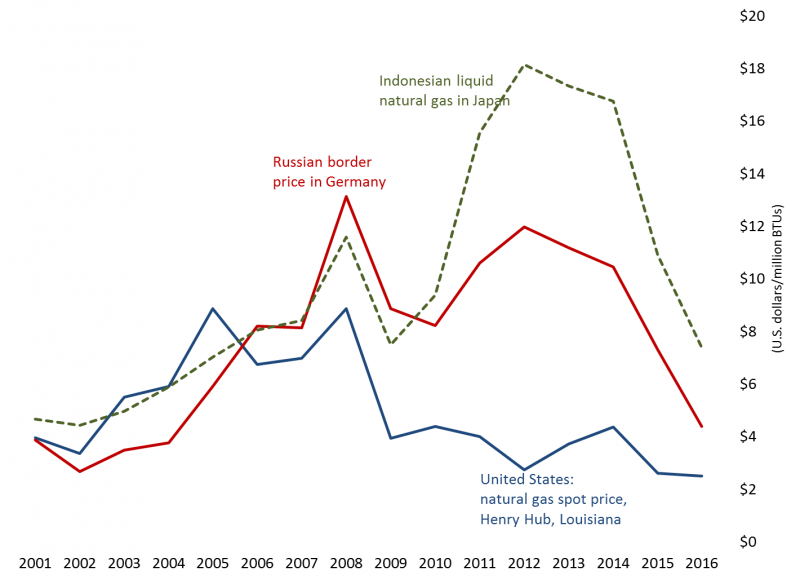
Source: Economics and Statistics Administration analysis using data from the International Monetary Fund/Haver Analytics.
Because tankers can continually cart millions of barrels of oil across oceans, oil prices have been set globally for decades. In contrast, natural gas has tended to travel through pipelines within countries or continents – with only about one-third shipped between continents. The recent surge in U.S. natural gas exploration has identified record levels of U.S. natural gas reserves and is now opening low-cost energy options to commercial and residential users across the country. In contrast, the northern European or Asian spot markets post prices ranging from twice to several times the prices paid in the United States.
One consideration to keep in mind, however, is that energy markets are in a period of rapid change. In April 2016, the United States began shipping natural gas to Europe potentially marking a turning point in the globalization of the market for this commodity. It remains to be seen whether foreign competitors be able to match the prices offered by U.S. producers.
Oil
Alongside the boom in U.S. natural gas production, the shale revolution has also changed oil’s role in the U.S. economy. In October 2013, U.S. crude oil production surpassed net imports for the first time since the early 90s. A few years earlier, at the start of 2011, the United States became a net exporter of petroleum products. As a result, the United States is more energy-independent than at any time in the past two decades. Companies choosing to locate production here can be assured of a fairly steady supply of accessible energy, whether from natural gas or crude oil sources.
U.S. Oil Production and Imports
1993-2017
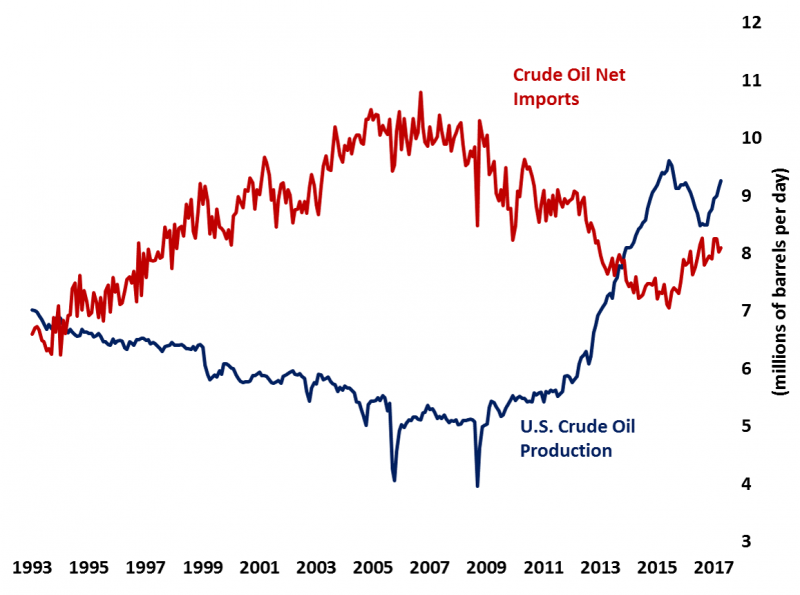
Source: Energy Information Administration/Haver Analytics
Increases in U.S. crude oil production over the last several years have coincided with large increases in production in Canada and the Middle East, driving global supply to record levels. This dramatic increase in the production of domestic energy goods has been a boon for most domestic industries, which rely on them for providing electricity to plants and offices, but it has also been a major benefit to industries that use these goods as inputs in their production processes – particularly petroleum refineries and a wide array of chemical products, from plastics to soaps.
At the same time, European and developing economies have been weak, easing demand for all of this crude. The result was a rapid decline in the price of crude oil to levels not seen since 2004. Since February 2016, crude oil prices have rebounded somewhat but still remain near their lowest levels since 2009.
Crude Oil Price per Barrel
2003-2017
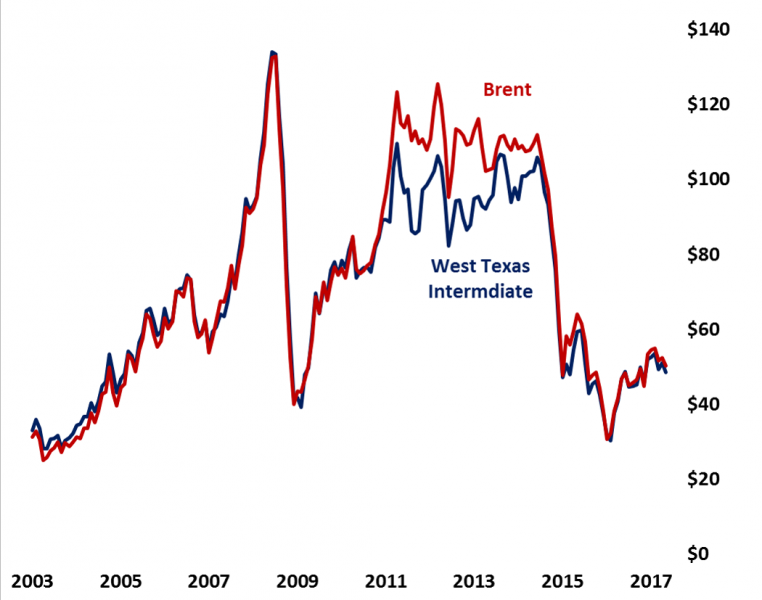
Source: Energy Information Administration/Haver Analytics
Because the price of crude oil is set in the global marketplace, it varies little internationally and therefore provides little information about where a company should locate its production. More meaningful is the retail price of petroleum products like gasoline. These prices, both because of the location of refineries and government policy, do vary quite dramatically by country. The World Bank publishes country-level data on the pump price of gasoline in U.S. dollars.
Pump Price per Gallon of Gasoline, Selected Countries
2014

Source: Economics and Statistics Administration analysis using data from the World Bank
As you can see in the chart above, the United States has some of the lowest gas prices in the world, largely beaten only by other major energy-producing nations in the Middle East and South America, and slightly beating out Russia. Gas in Europe and Asia is considerably pricier.
Electricity
The current mix of fuels and infrastructure help the United States compare favorably with other countries in terms of electricity pricing and reliability.[i] Likewise, while the procedures and time involved in getting electricity are comparable in the United States and many other countries, the cost tends to be considerably lower in the United States, as highlighted in the table below.
| Procedures (number) |
Time (days) |
Cost (% of income per capita) |
|
|---|---|---|---|
| United States | 5 | 90 | 24.4% |
| Brazil | 4 | 64 | 58.0% |
| Canada | 7 | 137 | 125.8% |
| Chile | 6 | 43 | 70.5% |
| China | 6 | 143 | 390.4% |
| Germany | 3 | 28 | 40.8% |
| Mexico | 7 | 100 | 336.7% |
| Poland | 4 | 122 | 19.0% |
| Singapore | 4 | 30 | 25.8% |
| South Korea | 3 | 18 | 38.3% |
Source: Economics and Statistics Administration analysis using data from the World Bank, Doing Business project.
Since 2009, power generation has been the most common domestic use of natural gas, followed by industrial, residential and commercial uses. Natural gas fuels nearly one-quarter of domestic electricity generation, and this share is expected to increase over the next quarter century. EIA forecasts suggest coal likely will remain the principal fuel firing domestic power plants.
Real Estate
In contrast to the majority of commodity inputs – whose prices are largely determined by global supply and demand – property values and rental costs are local. Because there is a lack of data for making general cross-country comparisons, comparing land and real estate rental costs across countries is not straightforward. In its Registering Property section, the World Bank's Doing Business project publishes data comparing the "steps, time and cost involved in registering property, assuming a standardized case of an entrepreneur who wants to purchase land and a building that is already registered and free of title dispute."
The following table compares this important start-up cost and process between the United States and a selection of other countries. Although these costs are more associated with the initial start-up activities of moving abroad rather than ongoing operations, the data highlight once again that purchasing land in the United States is relatively easy in terms of steps, costs and time.
| Procedures (number) |
Time (days) |
Cost (% of Property Value) |
|
|---|---|---|---|
| United States | 4 | 15 | 2.4% |
| Brazil | 14 | 31 | 3.1% |
| Canada | 6 | 17 | 3.1% |
| Chile | 6 | 29 | 1.2% |
| China | 4 | 20 | 3.4% |
| Germany | 6 | 52 | 6.7% |
| Mexico | 8 | 42 | 5.2% |
| Poland | 6 | 33 | 0.3% |
| Singapore | 6 | 5 | 2.9% |
| South Korea | 7 | 6 | 5.1% |
Source: Economics and Statistics Administration analysis using data from the World Bank, Doing Business project.
Conclusion
Manufacturers who are considering locating their plants overseas or sourcing abroad should consider the costs of all inputs to the production process, including raw materials, energy and real estate. Natural gas highlights how quickly cost calculations can change, as the boom in domestic production and decline in prices has made the United States much more attractive for expanding some manufacturing industries.
[i] For data on the quality of electrical infrastructure, see The Global Competitiveness Report 2016-2017.