


- Hourly wages alone do not tell the complete story when deciding where to locate a manufacturing plant or supply chain.
- Labor costs in other countries have risen sharply. In some cases, they have risen faster than productivity.
- Finding and retaining qualified manufacturing workers is a key management challenge that accompanies a move overseas.
Labor Costs – Just One Cost to Assess
If hourly labor costs at a given point in time were the only measure of the cost of operating overseas, then the decision to go abroad would be straightforward. The perception that labor costs are decisive helped fuel movement of U.S. manufacturing abroad in recent decades, and businesses continue to cite labor costs as a top factor driving the decision about where to locate production. Indeed, raw hourly labor costs are significantly lower in some other countries.[i]
However, this assessment of the cost of manufacturing outside the United States can be short-sighted. The expected savings from inexpensive foreign labor can be whittled away over time in numerous and unexpected ways. Labor costs can change quickly and substantially. Labor turnover in some countries can be particularly high, which directly leads to additional spending on recruiting new workers and indirectly to wage increases in order to maintain existing staff. Labor cost savings also may be partly offset by the risks of labor unrest and increasingly restrictive labor laws.
The Impact of Rising Wages on a Company's Bottom Line
Lower wage costs are one variable in a company's decision to manufacture or source from outside the United States. However, according to the 2017 China Business Climate Survey, rising wages in China remain a major challenge for businesses investing in that country. In each year from 2013 to 2015, businesses cited rising labors costs as their number one problem; while an inconsistent regulatory environment has taken over as the top problem cited in 2016 and 2017, rising labors costs remain the second most-cited challenge. As markets steadily open up to global commerce, wages continue to improve and enhance standards of living around the world. U.S. firms are often standard-bearers in labor practices when doing business globally.
Rising wages may impact the calculus of a company's margin of profit. In labor-rich markets like China, workers' wages have climbed at a fast rate through the 2000s. Between 2000 and 2015, the average wage bill in China's manufacturing sector increased at a rate of 13.3 percent, or close to six times the overall inflation rate.[ii] In contrast, the hourly compensation of manufacturing workers in the United States increased at a 2.8-percent annual rate during the same period, or 0.6 percentage points faster than growth in consumer prices. If these growth rates were to continue, U.S. wages by 2020 would be about 4 times higher than Chinese wages, down dramatically from 2008 when U.S. wages were 20 times higher than wages in China.[iii] This changing calculus should give companies pause.
While China's rapid wage growth is not the norm in many other countries, the manufacturing wage growth in a number of countries has easily outpaced wage growth in the United States – and may well surprise manufacturers who are not expecting such growth. Between 2000 and 2015, annualized manufacturing wage gains were, for example, 4.1 percent in Brazil, 5.2 percent in the Philippines, 5.9 percent in South Korea and 6.3 percent in Poland.
Exchange Rates
The unpredictable direction of exchange rates further complicates the calculus. Even if changes are expected, firms need to remain cognizant of their impact on relative labor costs – and all costs discussed elsewhere in Assess Costs Everywhere. For instance, the Chinese yuan has increased in both value and volatility, from a rate of 7.29 yuan per U.S. dollar at the beginning of 2008 to a rate of 6.20 yuan per U.S. dollar at the end of 2014, followed by a sharp downtick to 6.95 yuan per dollar at the beginning of 2017. This marks an overall increase in value of about 18 percent (2.3 percent per year), from 2008 to 2015, followed by a rapid decline of 11 percent (5.5 percent per year) from 2015 to 2017. Which of these trends will hold for the next five years?
Currency fluctuation is common across all countries. The euro declined from a recent high of around 0.71 euro per U.S. dollar in April 2014 to near-parity at the end of 2016 before bouncing back slightly to around 0.91 euro per U.S. dollar in May 2017. For most of 2014, one U.S. dollar bought about 102 yen, but that number began to rise late in the year, reaching a peak of 124 yen per U.S. dollar in mid-2015 before falling back to 100 yen per dollar in late 2016. As of May 2017, one U.S. dollar bought about 113 yen. The U.S. dollar has also fluctuated against the Australian dollar, the Brazilian real, the Canadian dollar, the Indian rupee, the Mexican peso, the Thai baht and many other currencies.
Exchange rate forecasts are available from investment and economic consulting firms, often on a subscription basis. One good free source for exchange rate forecasts is the International Monetary Fund (IMF) and its World Economic Outlook database. Take note, however, that these forecasts are published in purchasing power parity (PPP) terms, which also adjust for other factors that determine how far the local currency goes in the local market. Nevertheless, market exchange rates can be implicitly calculated using IMF's forecasts of a country's GDP, which are published both in terms of the local currency and in U.S. Dollars.
Productivity Matters
Unit labor costs provide an easy gauge of the relationship between wages and productivity. Defined as the labor costs associated with producing one unit of output, unit labor costs measure "bucks for the bang” – which are directly proportional to the bang for the buck. When wages rise faster than productivity, unit labor costs climb because each bang costs a few more bucks.
Indexed Unit Labor Costs in the Manufacturing Sector of Selected Countries, 2000-2016 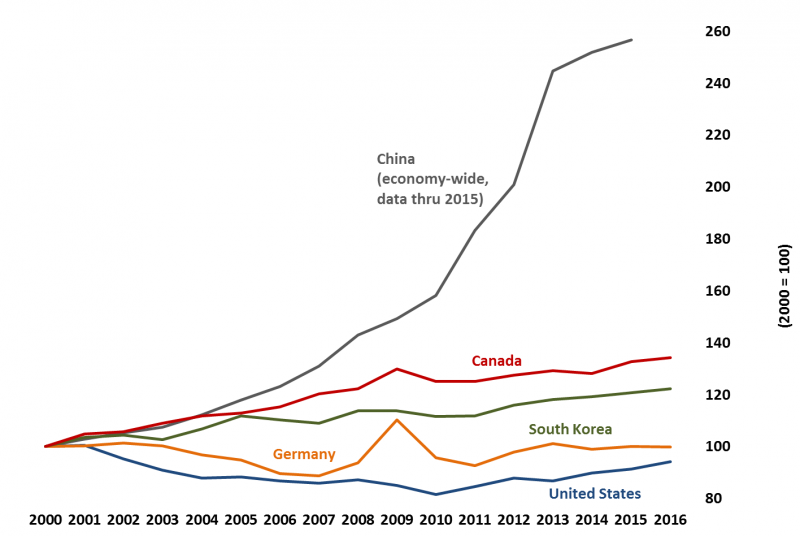
Source: Economics and Statistics Administration analysis of data from The Conference Board, International Labor Comparisons program and National Bureau of Statistics of China.
The figure above shows how unit labor costs changed since 2000 in several countries (but does not compare costs across those countries). In the United States, unit labor costs decreased by nearly 20 percent between 2000 and 2010, meaning that productivity rose faster than labor costs. While they have since risen following the end of the recession, they remain about 6 percent below their level 16 years ago. That is not the situation in many countries that are often considered as destinations for outsourcing. In the case of China, for example, the opposite occurred: wage increases have easily outpaced labor productivity growth. As a result, economy-wide unit labor costs in China are 2.5 times higher than in 2000.[iv] Canada and South Korea also faced rising unit labor costs, with 34- and 22-percent gains, respectively. In Germany, unit labor costs saw several increases and decreases but ended the period almost exactly where they started.
Let's consider what these trends can mean to an individual business. Consider the hypothetical case of ACE Hyperwidgets, Inc., which is deciding where to establish a new widget production facility. Let's assume that it costs $30 per hour to hire a widget maker in the United States and 93 percent less, or just $2 per hour, to hire a widget maker in country X.[v] With this stark difference, ACE Hyperwidgets, Inc. could just end its analysis here, but it would be overlooking two huge issues: productivity differences and exchange rates. Production is less mechanized in country X and workers have lower educational attainment than in the United States. As a result, U.S. workers produce 20 widgets per hour, while workers in country X churn out just 5, or 75 percent fewer.[vi] Putting these data together, we see that the direct labor costs are $0.40 per widget produced in country X, or 73 percent less than in the United States. However, if we assume trends in Country X mirror those of China from 2000 to 2015, we see that these costs can change dramatically over the next 15 years.
| United States | Country X | Percent Difference | |
|---|---|---|---|
| Year 1 | |||
| Wage (local currency/hour) | $30.00 | XD 10.00 | |
| Exchange rate (local currency/US$) | 1.00 | 5.00 | |
| Wage in US$ | $30.00 | $2.00 | -93% |
| Productivity (widgets/hour) | 20 | 5 | -75% |
| Unit Labor Cost (labor $/widget) | $1.50 | $0.40 | -73% |
| Year 15 | |||
| Wage (local currency/hour) | $45.32 | XD 64.68 | |
| Exchange rate (local currency/US$) | 1.00 | 3.75 | |
| Wage in US$ | $45.32 | $9.80 | -78% |
| Productivity (widgets/hour) | 33 | 19 | -44% |
| Unit Labor Cost (labor $/widget) | $1.37 | $0.53 | -61% |
Wage increases in country X can erode these savings over time, especially when wage growth outpaces workers' productivity gains. If relative wage, productivity and exchange rate increases are comparable to those experienced by the United States and China between 2000 and 2015, then the unit labor costs for the United States would actually shrink slightly, to $1.37, and country X's would rise to $0.53. The resulting savings from offshoring would erode by nearly 20 percent, from 73 percent to 61 percent.
Turnover
Productivity alone does not explain the sizeable wage increases in many countries. One oft-cited factor driving wage growth is the difficulty firms in some countries have attracting and retaining staff, especially skilled workers. This difficulty forces companies to raise wages in an effort to retain workers and reduce turnover. Furthermore, firms incur costs as they find and train new workers to replace those who have quit. For example, a recent study from the Hay Group estimated that India's turnover rate would reach 26.9 percent in 2013. In contrast, the Bureau of Labor Statistics estimated that turnover in the United States was 20.3 percent in 2013.
One notable change in recent years is a reduction in turnover rates in China. According to Aon, a human resources consulting group, China’s turnover rate in 2013 was only 18.9 percent – lower than the 20.3 percent rate in the United States that year.
Turnover imposes many costs on companies. These costs include expenses from substituting for the departing employee temporarily, compensation for the output of the temporary employee, exit interview expenses, costs associated with the job contract, the manager’s time required to understand the causes of departure, previous investments in the employee’s education and training, loss of institutional knowledge and a decrease in productivity associated with the loss of an experienced employee. Overall, costs associated with turnover may be more than 1.5 times the annual wage of the worker.
One study found that turnover affected the efficiency of plant operations in Mexico's maquiladoras (export plants in free-trade zones). According to the study, even when the costs of replacing workers are low, high turnover rates can result in considerable direct expenses for firms, as well as indirect costs in terms of reduced product quality, reduced productivity and increased overtime costs. In this case, the increase in scheduled overtime actually led to additional turnover as workers were unable to juggle the extra factory hours with second jobs they held in the informal economy, which paid more per hour than the on-the-books overtime.
Turnover reflects just one aspect of the management burden and costs of coordination that accompany a move offshore. These burdens increase when the firm is a small- or medium-sized enterprise with little or no overseas experience. Lacking local contacts to oversee day-to-day operations, such firms are forced to send U.S.-based managers overseas, incurring the associated travel and opportunity costs, like time spent out of the office. If these firms instead try to hire local managers, they may find themselves in a quandary. Given already high turnover rates in these countries, managers – like skilled production workers – can be difficult to recruit and retain; indeed, lack of qualified employees and managers were the second and third most-cited human resource problems in 2015 and 2016, respectively, according to the China Business Climate Survey.
Other Labor Risk Factors
Rising wages, lower productivity and difficulty with turnover are not the only factors to consider in the labor equation.
The Economist Intelligence Unit (EIU) aggregates these and other "labor market factors... likely to disrupt business operations" into a single measure of "labor market risk." These risk indicators feed into an overall score from 0 to 100, with 100 reflecting the highest risk to business profitability. As of April 2017, the United States posts a score of 14, tied with Switzerland and Hong Kong for the second-best score of the 180 countries assessed, ranking below only Liechtenstein. Japan and many European countries posted scores in the 20s, including Germany (29). Vietnam – often the location of choice when China is too pricey – had a score of 61. According to EIU, China also came in relatively high in terms of labor risk – posting a score of 57. Mexico's score of 50 was right in the middle.
Labor Market Risk Score by Country, May 2017

Source: Economics and Statistics Administration analysis using data from the Economist Intelligence Unit.
Conclusion
Foreign hourly labor costs are just one factor to consider in the overall labor cost equation. When deciding whether it is better to manufacture outside the United States, companies should also consider rising wages, lower productivity, difficulty with turnover and relatively high labor market risks. Looking at the entire labor cost equation demonstrates the soundness of manufacturing in the United States.
[i] These data are hourly compensation costs, which include direct pay, social insurance expenditures, and labor-related taxes. Estimates of wages and of direct benefits, which primarily includes pay for leave time and bonuses, are available from the Conference Board.
[ii] Year-to-year percentage change in national average money wages by sector. Data are from China's Ministry of Labor and Social Security/Haver Analytics.
[iii] These growth rates also factor in exchange rates. The Chinese yuan has appreciated against the U.S. dollar at an annual rate of about 2.2 percent between 2000 and 2012, making the total effective annual growth rate in Chinese manufacturing wages 16.7 percent over this period.
[iv] Data are from China's National Bureau of Statistics/Haver Analytics. Figures for China's manufacturing sector are not available.
[v] Compensation includes wages as well as social insurance expenditures and labor-related taxes.
[vi] This productivity difference is comparable to Boston Consulting Group's estimates of the relative productivity of U.S. and Chinese manufacturing workers in 2010.